Shape allows you to display your images and p-v diagrams in four different color codes. The default color coding renders the image in the colors that have been assigned to each subobject in the 3D Module.

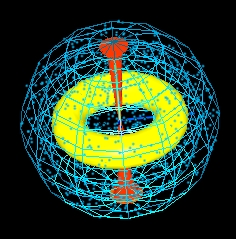
In the example below there is the 3D mesh of an object that is composed of a blue sphere, a yellow torus and a pair of red jets.
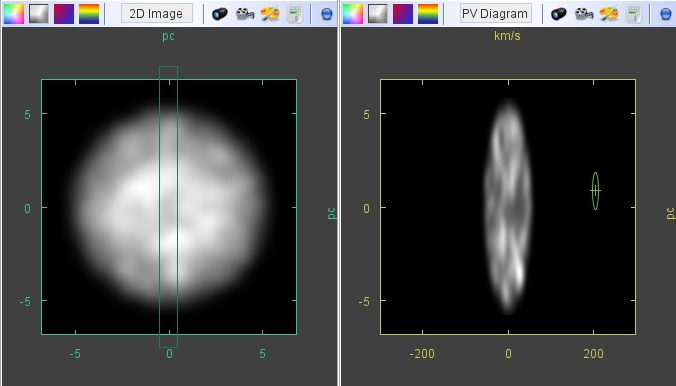
In the rendered grey-scale image (left) and p-v diagram (right), the torus and the jets are indistinguishable from the emission of the sphere, because their emission integrated along the line of sight is small compared to the volume filled sphere.
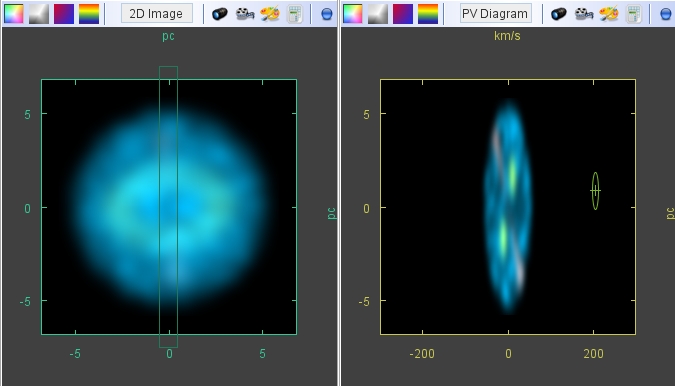
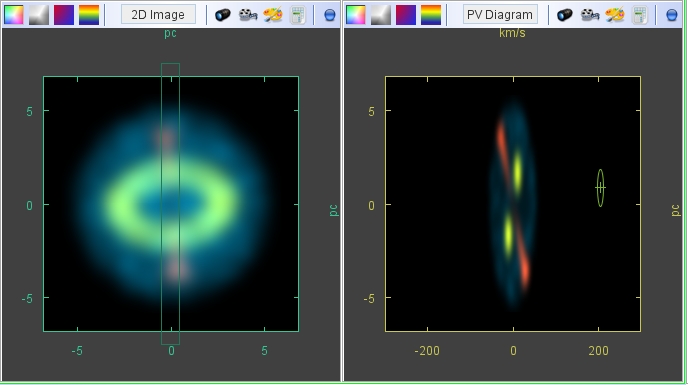
However, in the color image below, a hint of the yellow torus can be noticed in the position-velocity diagram on the right. In the p-v diagram, even the faint red jets can be distinguished from the noisy structure of the sphere. The yellow torus clearly stands out. The coloring of the sub-objects helps to identify them in difficult situations in the model and there to find corresponding features in an observation.
If the brightness ratio between the different components is similar the colors very easily allow to distinguish between them in the images.
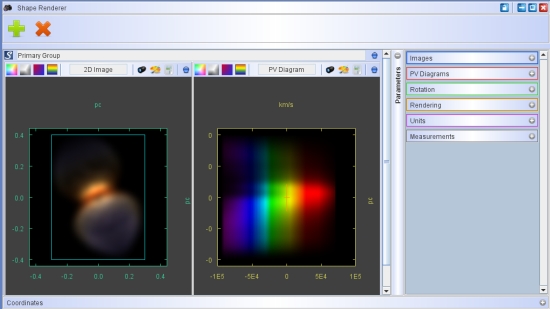
The red-blue image type shows which regions of the object are blue or red-shifted by the Doppler-effect, i.e. which are approaching or receding from the observer, respectively. To activate this view select the red-blue icon:

Finally, the rainbow image type, instead of showing only whether a region is approaching or receding, color codes a given velocity range with the rainbow colors. Violet means the gas is approaching fastest, green signals very low velocities and red shows fast receding motion. The velocity range for the color coding is set in the P-V diagram tab of the parameter panel in the Main Interface.The colors used here will be the same as those used for the velocity vectors that you can use to visualize the velocity field in the 3D Module.